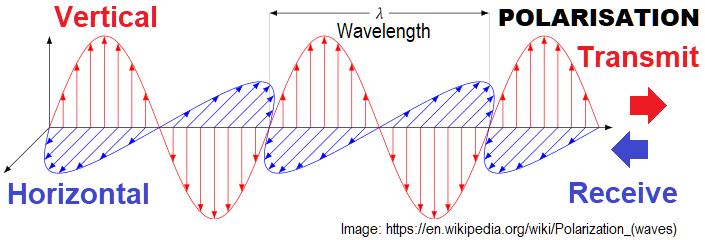
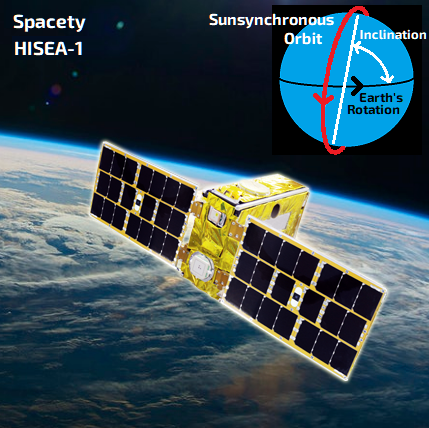
Hisea-1 is a SAR (Synthetic Aperture Radar) micro satellite developed by Spacety, using VV polarisation (vertical emission and reception, image below), with resolution up to 1m. It was launched in 2020, in a sun-synchronous orbit at near north-south inclination, at a height of 512km, carrying a miniaturised iodine thruster engine for orbit maintenance. It can acquire images of the same place on Earth up to each 4-5 days interval (revisit time changes according to latitude), since its orbit keeps turning while the world goes round, being able to acquire data day-and-night and independent of weather conditions like absence of clouds.
Polarisation is the orientation of the electromagnetic waves emitted by a radar satellite. HISAR-1 Satellite uses VV, vertical for transmit and receive:
Brief explanation of SAR images
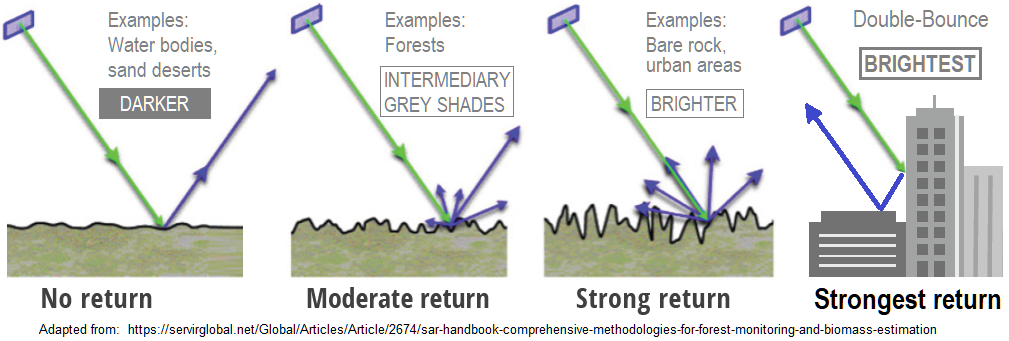
SAR satellites emit signals to the ground and collect their return as the signals reflect and backscatter when hitting objects. The resulting image is in greyscale. For a simple comprehension:
the more flat (like lakes and sand deserts), the more signals are reflected away from the sensor;
the more rough an object is (like rocks and forests), the more returned signals the satellite may collect;
objects with faces at 90° to the ground (like buildings) return the highest intensity due to double-bouncing.
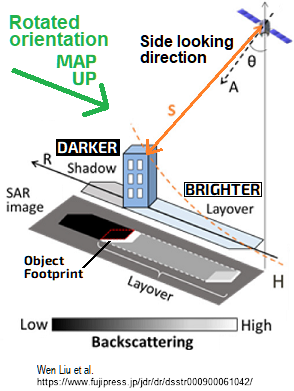
SAR images are acquired in an oblique view (relative to nadir; not vertically downwards). This means the primary data (Level-1) is distorted relative to the ground plane. For a planimetric orientation, the data needs a second process (Level-2) to rectify images as in an orthogonal map.
Topographic profile: The full 170km extent of 'The Line Project' climbs from 0m at sea level to a maximum of almost 1,300m altitude. Will the finished project actually be a straight line? View on Soar.
Hisea-1 is delivered in these two types of data product for a given scene (scheme below):
Level-1 SLC (Single-Look Complex) product is not actually an image: it contains the primary raw data at native projection;
Level-2 ORG (Orthorectified and Geocoded) product, which is the single-look as projected to the terrain and rectified (though not processed for multi-look and speckle filtering), delivered as up to 1m pixel resolution and ready-to-use.
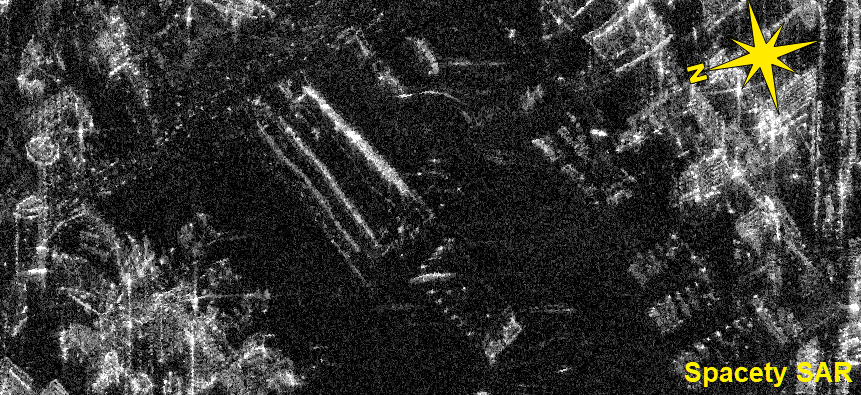
After that second process (Level-2), when the image is orthorectified, we can see the geometry of objects in the ground, based on their layover and shadow (scheme above, and images below).
The layover image shows the object’s sides that the satellite is actually seeing as brighter signals, however reflected and mirrored upside-down relative to the line of view of the satellite. So that’s why we rotate the map to be aligned contrary to the line of view. This way we can see the layover image of buildings like we are naturally used to seeing, as if they were emerging from the ground like in a 3D view, vertically oriented. It is a useful data for the analysis of heights of objects.
The shadow is what the satellite can’t see, the hidden sides of objects, projected to the opposite side of the layover, appearing as dark shades. The real location of the object’s footprint on the ground is in the interface between the layover and the shadow of objects.
Since original SAR images may be too dark due to peaks of values, it’s usual to balance the luminosity using decibel range conversion, which makes its visualisation smoother in the grayscale.
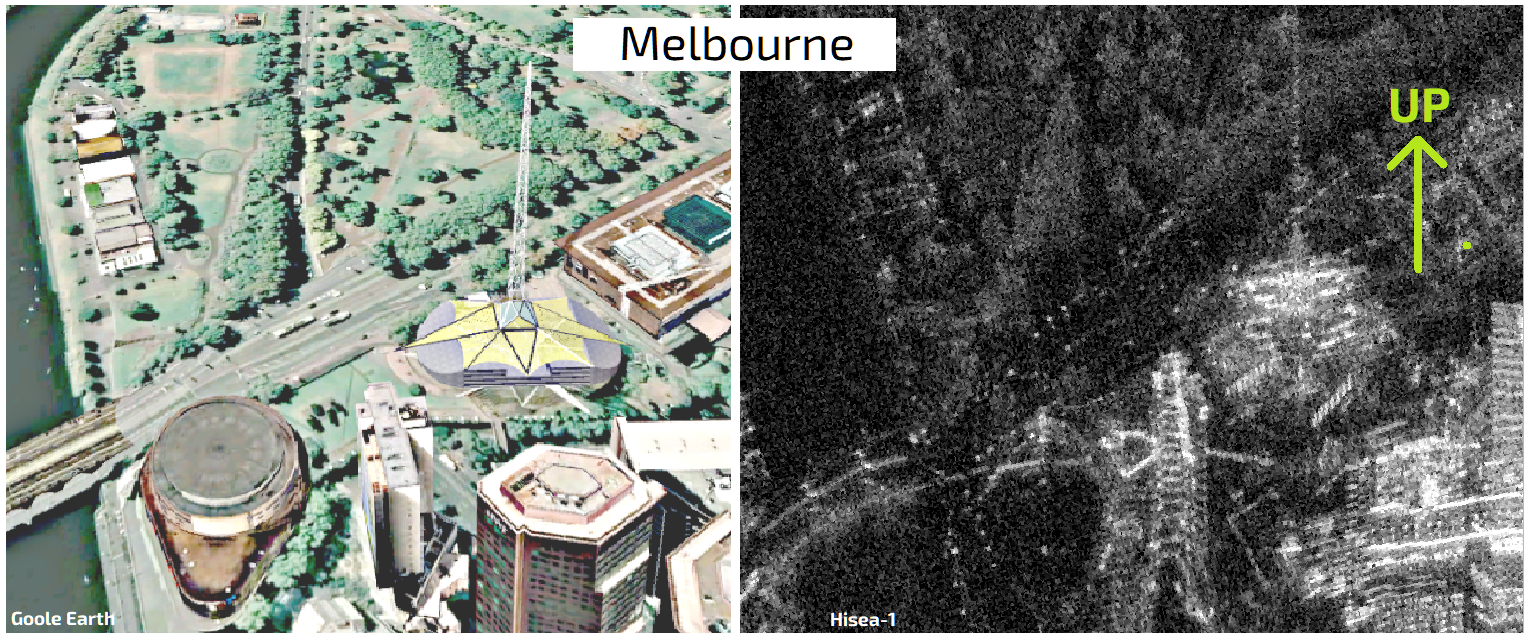
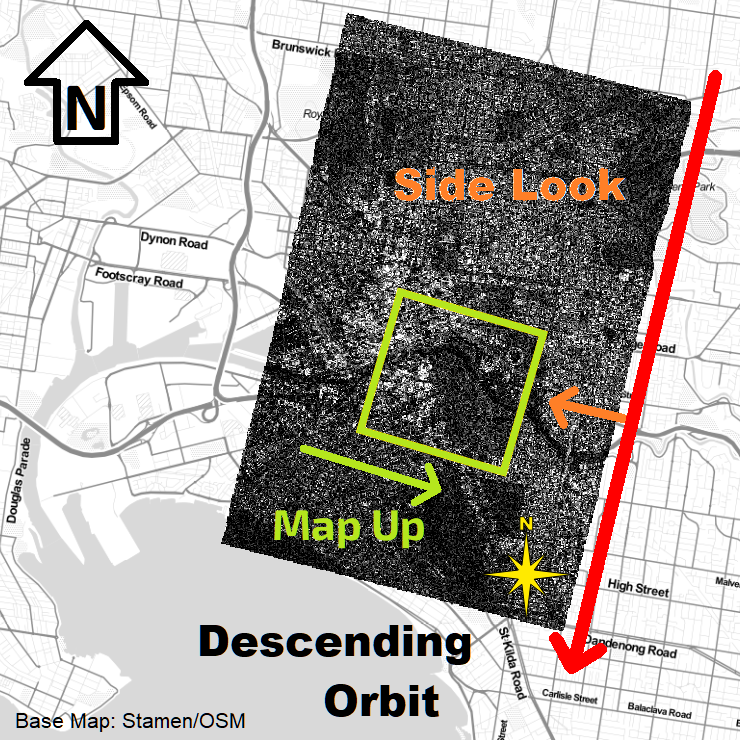
In the next images we show a short analysis on the Level-2 ORG product 1m pixel resolution, focusing on their sample over Melbourne, Australia. This image was acquired in a descending orbit, being side looked to the right (map beside). So we rotated the map aligned to the satellite’s side looking line of view, but contrary to it, for better visualisation of vertical data.
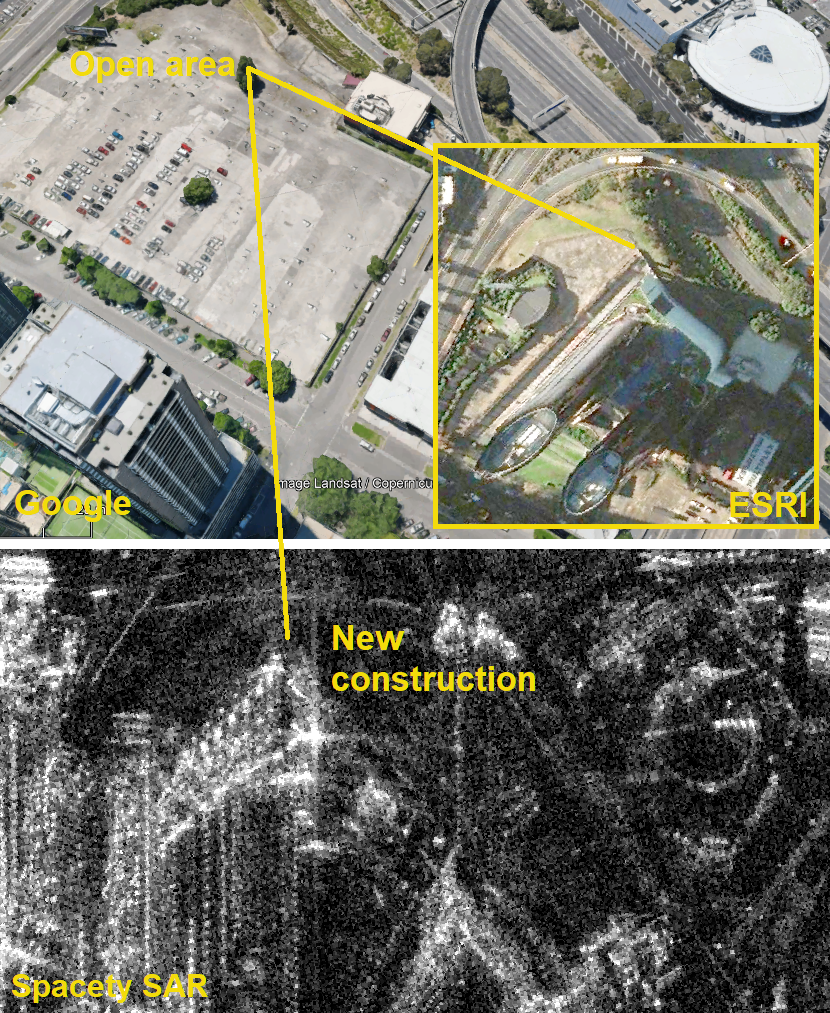
In these images we see some zoomed in details, using the decibel scale for enhancement of luminosity. We can see many objects like buildings, tree rows, vehicles in the roads, boats in the water; also we can count the number of building floors, as well as detecting new constructions that don’t appear in conventional base map images that are usually a bit outdated.
Due to the 30m Global DEM (Digital Elevation Model) used to orthorectify the data, there can be some horizontal distortions. When it’s possible to have access to local DEM, like provided by municipalities, the ground accuracy may be improved.
Sérgio is a mapping and remote sensing enthusiast, producing content for Soar. He studied geology and holds a Master of Philosophy, and is now an architect and contributor to OpenStreetMap and OpenData communities. He believes that information and knowledge are first steps towards personal fulfilment that lead to a better world.