October 2nd, 2025

Have you ever wanted to create a time-lapse of the Earth from space? Maybe to highlight the difference between two dates, or showcase how a location transforms over time? Now you can - right inside Soar!
We've made it incredibly easy to generate animated map GIFs using satellite imagery. No need for GIS software, no downloading individual frames and stitching them together. Just choose your location, select your dates, and hit “Generate”. In seconds, Soar creates a shareable GIF of your map, ready to drop into reports, social media, or presentations.
What Are Map GIFs?
Map GIFs are animated loops made from a series of satellite imagery, showing real-world change across time. Whether it’s months of deforestation, flooding over a week, or a city growing year by year, these GIFs let you see change instantly.
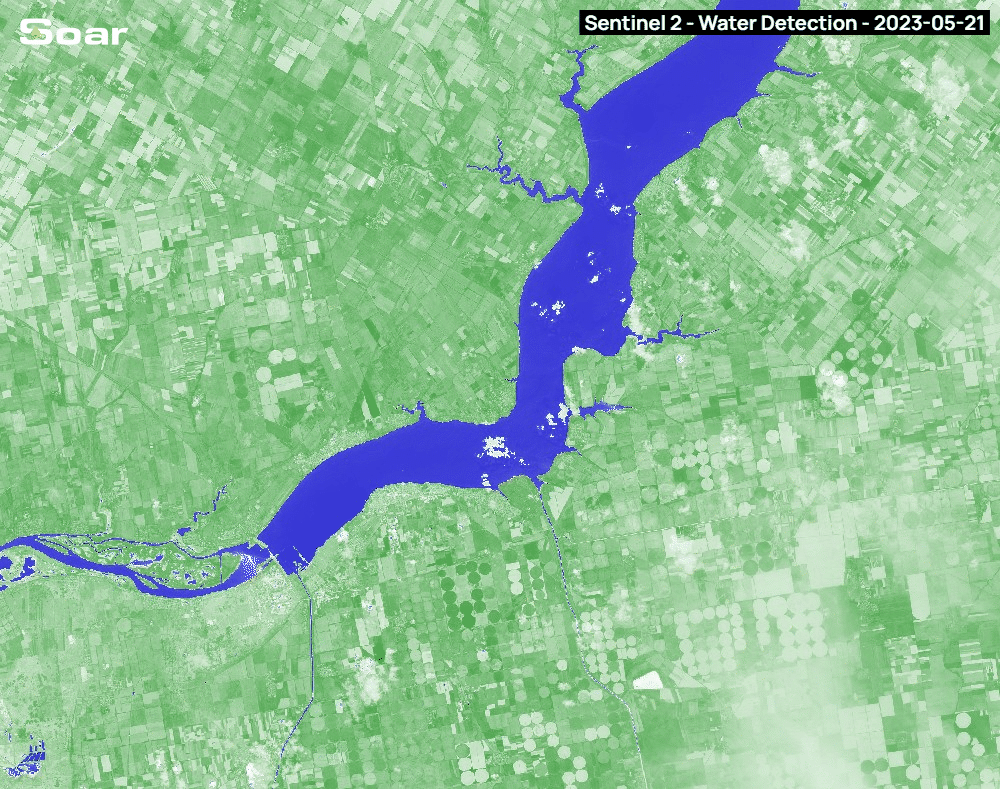
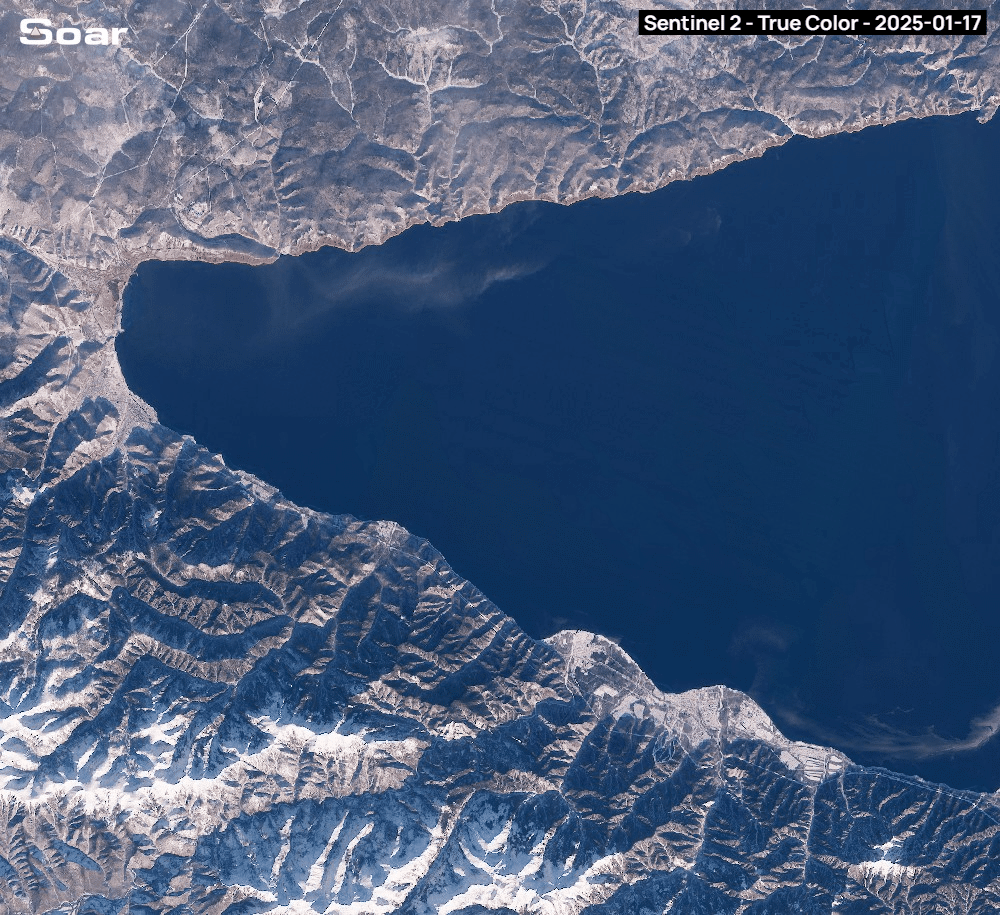
A Soar Map GIF capturing the draining of the Dnieper River in Ukraine (left) and another of Lake Baikal freezing over. (right)
How It Works
Soar taps into the European Space Agency’s Sentinel-2 satellite, which captures high-resolution images of the Earth every few days. Our platform pulls these images together and now you can add them to a timeline to turn them into a smooth, looping GIF.
Here’s how to do it:
- Search for your location – You can look up any place on Earth.
- Select your dates – Choose the captures you want and add them to your timeline.
- Click 'Generate GIF' – In just a few moments, Soar will compile your imagery and generate a high-quality animated GIF you can download or share online.
- Upload it to Soar as a GIF map! – Best of all, you can hit the "Upload to Soar" button after generating your GIF to save it to your profile as an animated map. Unlike other platforms, these GIFs will be georeferenced which means they'll be placed over the basemap, adding context!
Take a peek at our quick tutorial. It can be done in just over a minute! It’s that easy. 😱
Why It’s Awesome
Creating animated map GIFs gives you a powerful new way to tell stories with data. Whether you’re a researcher, journalist, environmentalist, or just a curious explorer, this tool opens the door to visualizing change in an intuitive, impactful way everyone can understand.
Here’s some ideas you might want to explore yourself:
- Deforestation in the Amazon
- Urban sprawl in major cities
- Seasonal changes in farmland
- Water levels in lakes and reservoirs
- Bushfire scars and regrowth
- Glacier retreat over the years
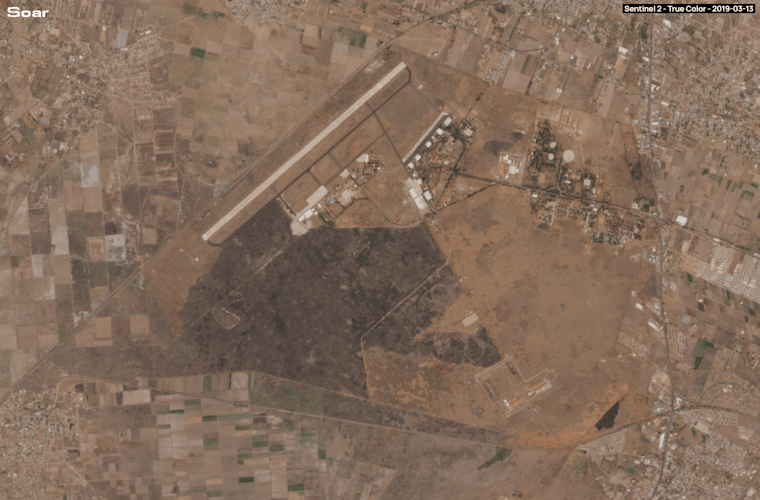
A Soar Map GIF capturing the construction of Felipe Ángeles International Airport, Mexico - 2019 to 2023
If you want to get creative, you can even throw your new GIF back into Soar as an interactive Stoary, letting you annotate your map with text, iconography, images, and different pages. We’ve already seen some stunning examples that show just how powerful these GIFs can be.
Map GIFs are live now on Soar and free to use for everyone. It’s so easy, it takes less than a minute, so go ahead, pick a spot, choose your dates, and hit play!

This blog was written by:
Michael Pearce
Michael is the head of outreach for Soar. He has a background in video game development and enjoys spending time with pigeons in the city.