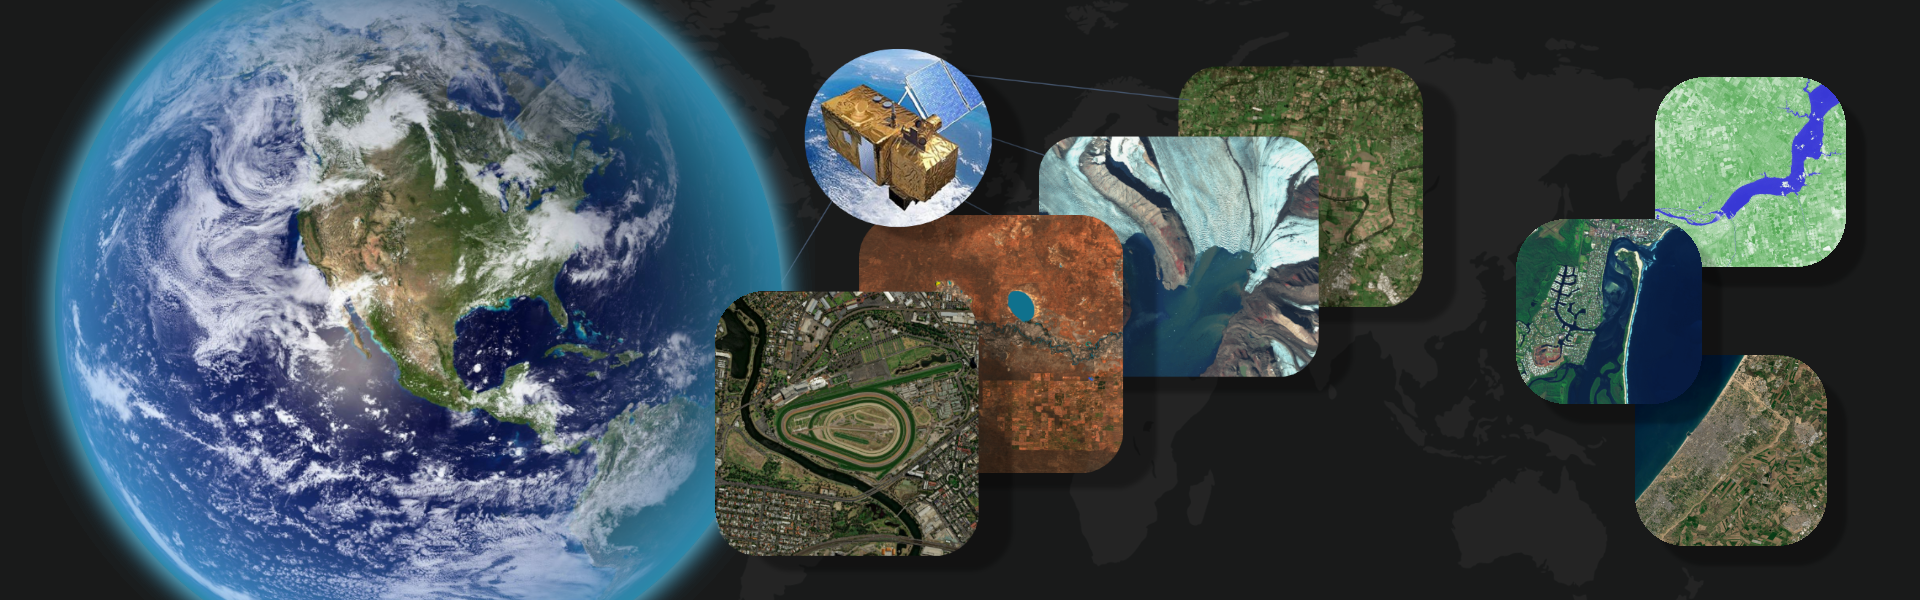

Seeing the world from above is already an incredible experience, and with free tools like Soar, anyone can explore satellite imagery from almost any place and time on Earth. But what if you could go even deeper?
Soar’s newly revamped filters feature lets you do just that. With 19 powerful filters, you can reveal hidden details, detect environmental changes, and visualize data in entirely new ways. Whether you’re an environmental analyst, GIS specialist, researcher, journalist, or simply curious about how our planet is evolving, these filters open up a new dimension of exploration in satellite imagery.

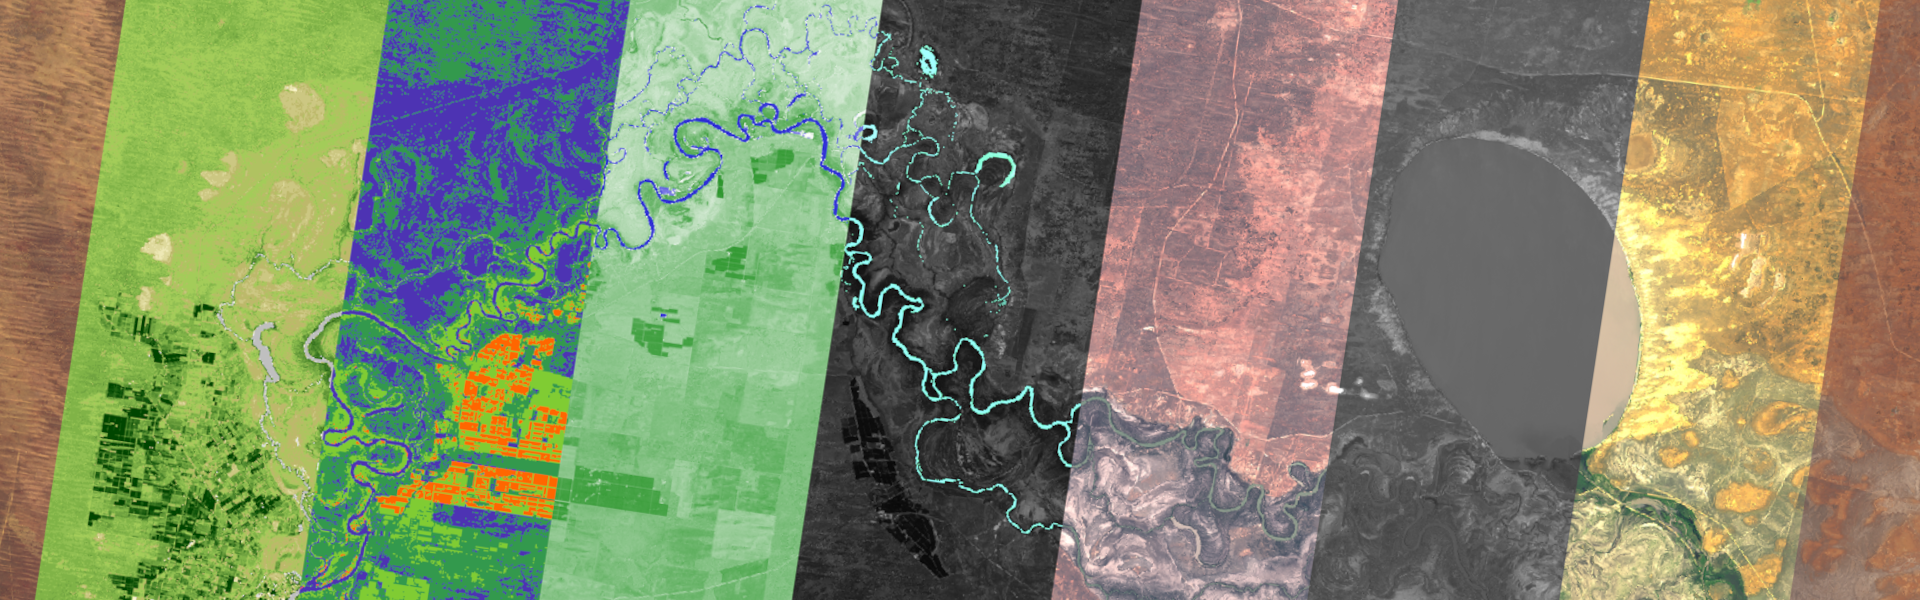
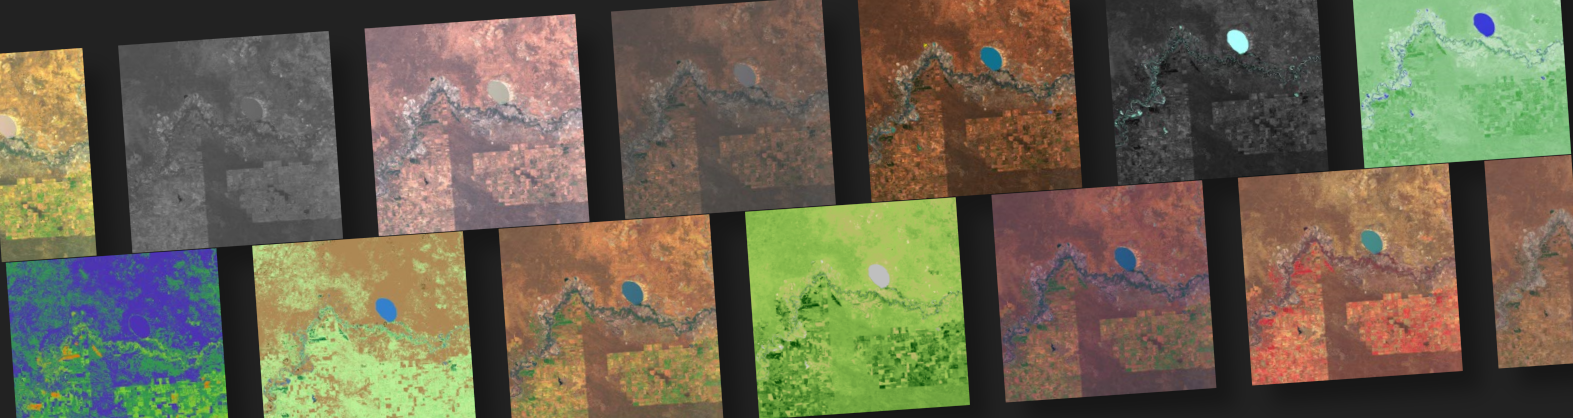
Each filter processes the satellite image differently, highlighting specific features or patterns that would otherwise be difficult to see. These filters aren’t just colour changes, it’s based on real data that can be handy for all sorts of research and visualization applications.
Getting started is simple. Visit www.SoarAtlas.com/satellites, zoom into the area you wish to capture and draw out a box. On the left, you’ll see a list of recent dates with satellite captures. Just above it is where the filters tab is located.
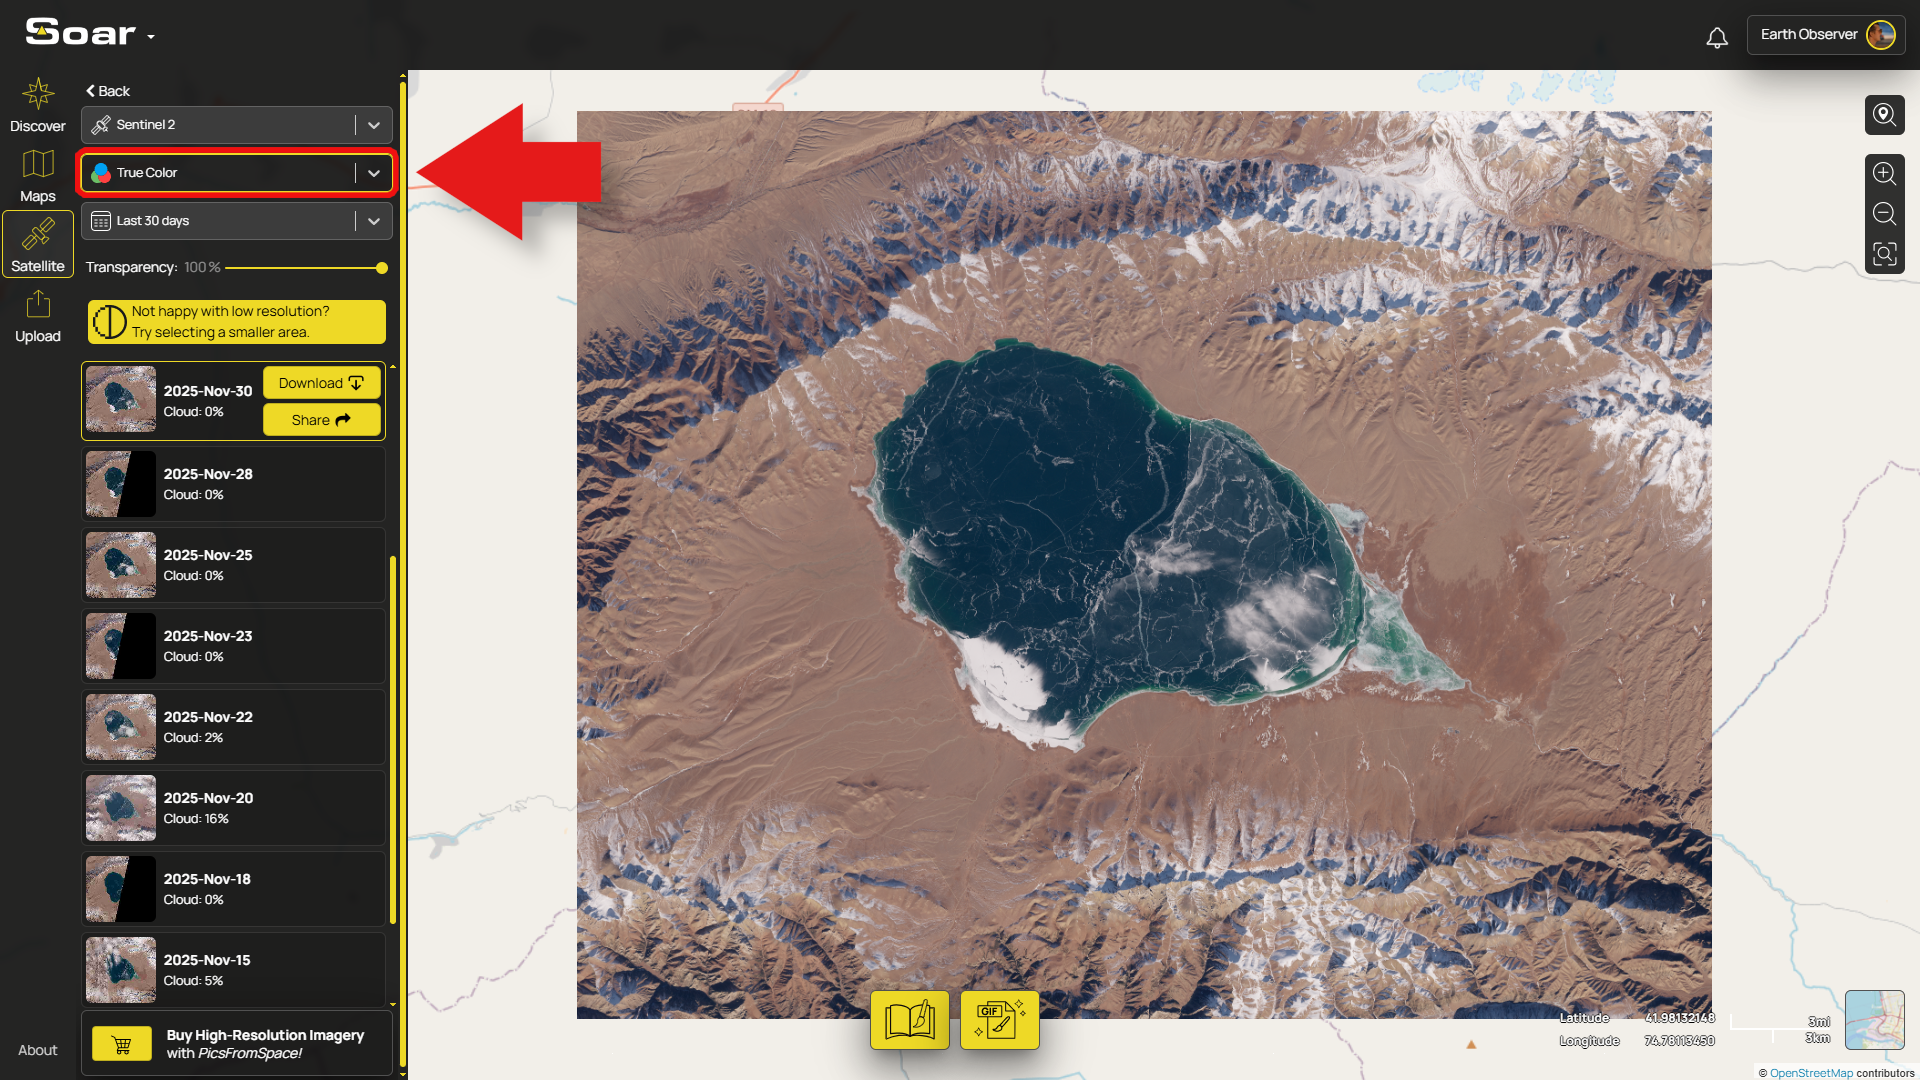
By default, it’ll be set to “True Color”. From there, you can scroll through the full list of filters and select which one you’d like to use. Just hover over each one to get a description of what they do and how they're useful.
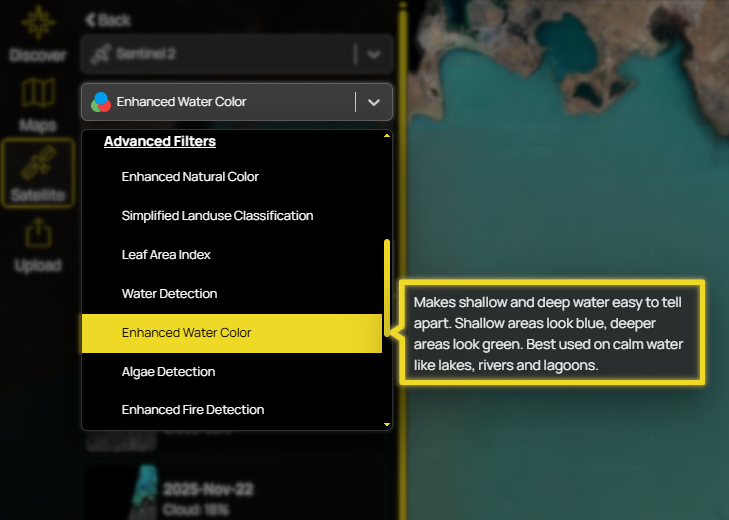
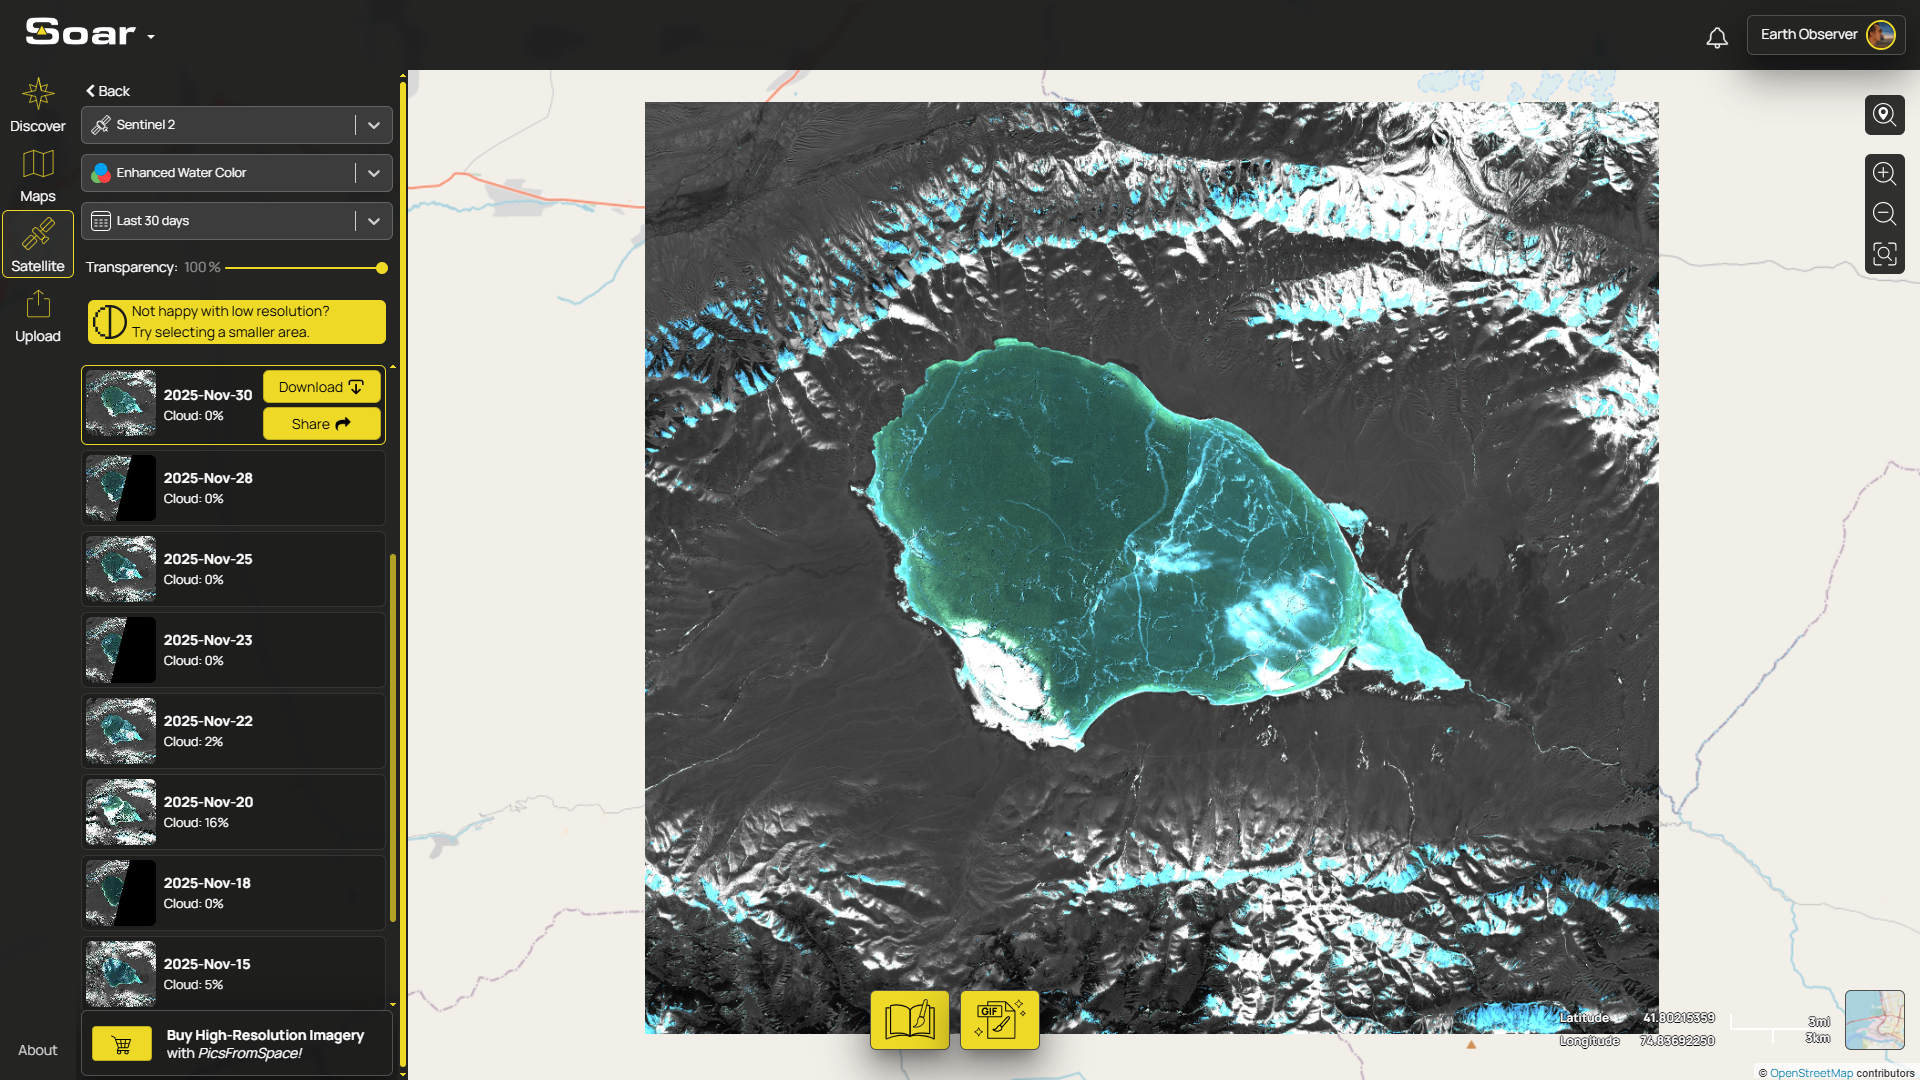
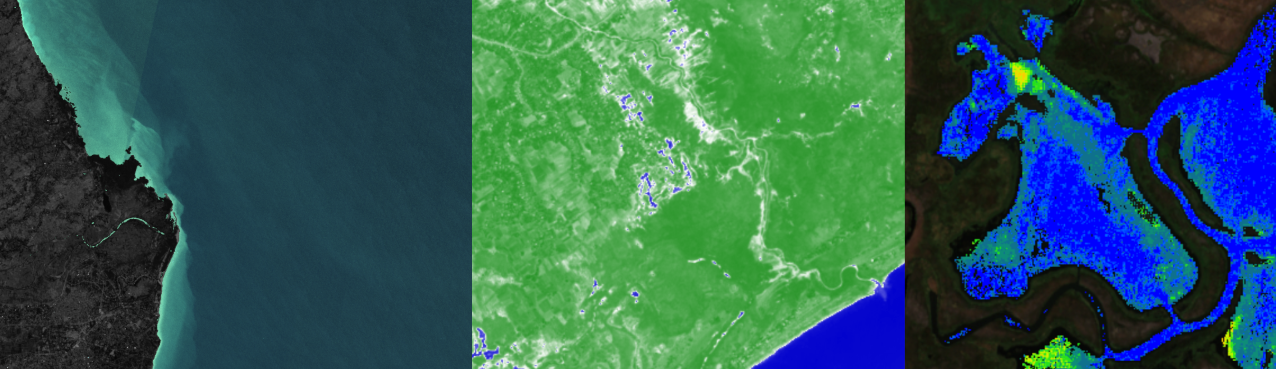
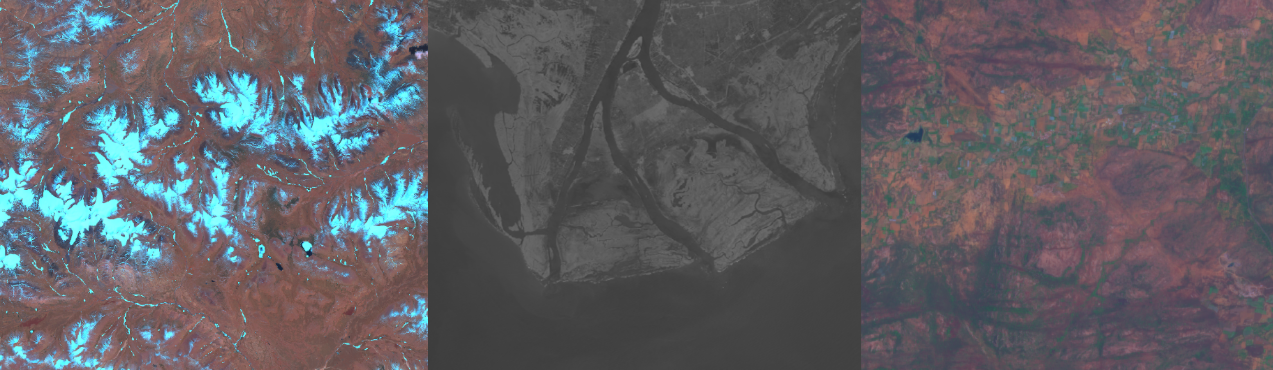
Each filter can dramatically change the appearance of the image. For instance, choosing “Enhanced Water Color” will adjust the colours to highlight water depth.
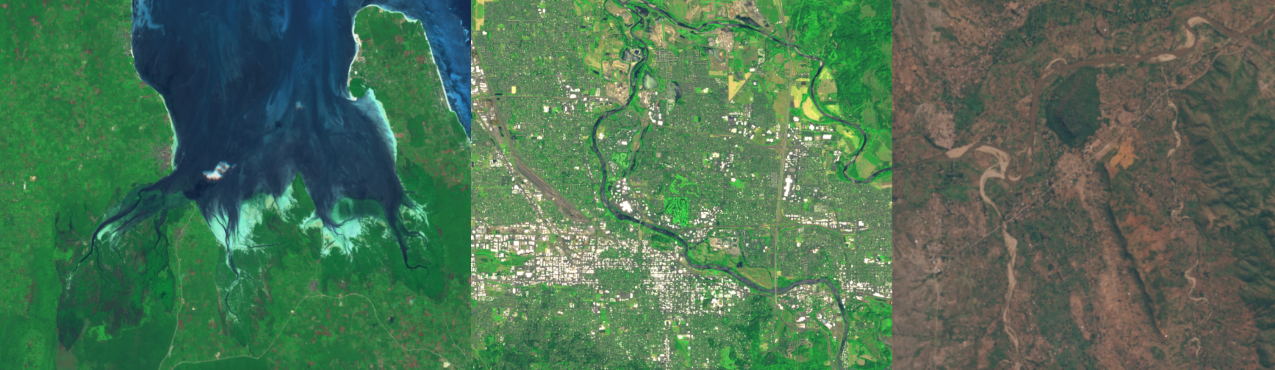
Just like above, the same location can look completely different depending on which filter you use. Just take a look at the difference between “True Color” and “Enhanced Fire Detection” below.
You can see how this filter highlights the areas in the image that contain high levels of heat, glowing in red and orange.
These handy filters transform Soar from a map viewer into a truly analytical tool, giving you satellite imagery that can be deeply insightful!
Let’s dive into each filter to see how they may be useful to you in your mapping journey:
True Color
Shows the Earth as close as possible to how your eyes would see it.
Enhanced Natural Color
Looks similar to True Color, but makes buildings, soil, and vegetation stand out more clearly using extra satellite data.
Tonemapped Natural Color
Gives a more balanced, photo-like look by adjusting bright areas and shadows so you can see more detail.
Selective Enhancement
Boosts specific features like forests, water, or snow to make them pop while keeping everything else natural-looking.
False Color
Makes healthy plants and trees show up as bright red. The redder it is, the healthier the vegetation.
Enhanced Vegetation Health
Shows how healthy the plants are by using infrared light that picks up plant activity, useful for farming or forest checks.
Leaf Area Index
Tells you how much leafy vegetation is in an area. More leaves = greener colors.
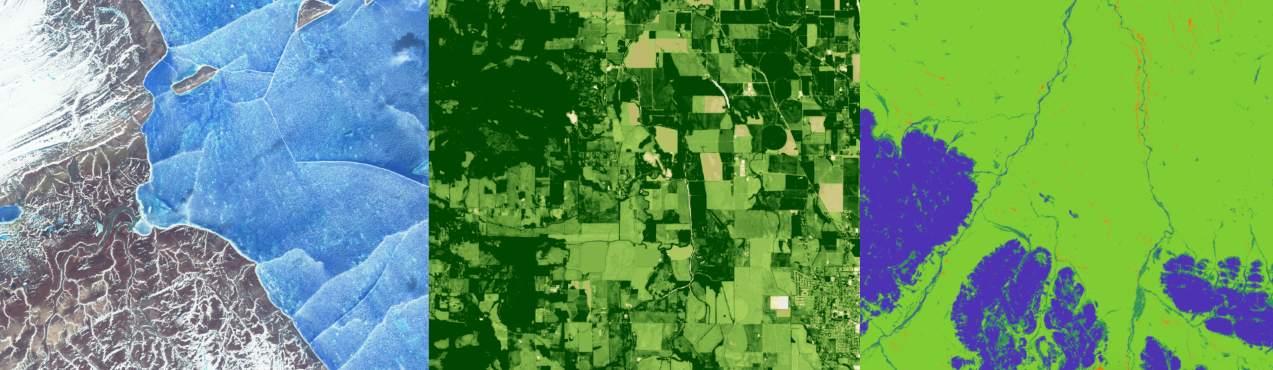
Simplified Landuse Classification
Colors the map based on land type, showing forests, grasslands, water, or bare ground in different colors.
Artistic NDVI Color Script
Adds an artistic touch to vegetation maps, using color to show how healthy or sparse the greenery is. No plants = white, healthy = yellow.
Water Detection
Highlights lakes, rivers, and oceans in strong blue. Keep in mind that shadows (like from mountains) might sometimes be mistaken for water.
Enhanced Water Color
Makes shallow and deep water easy to tell apart. Shallow areas look blue, deeper areas look green. Best used on calm water like lakes or lagoons.
Algae Detection
Shows where algae blooms might be happening in lakes or oceans. Helpful for water quality monitoring.
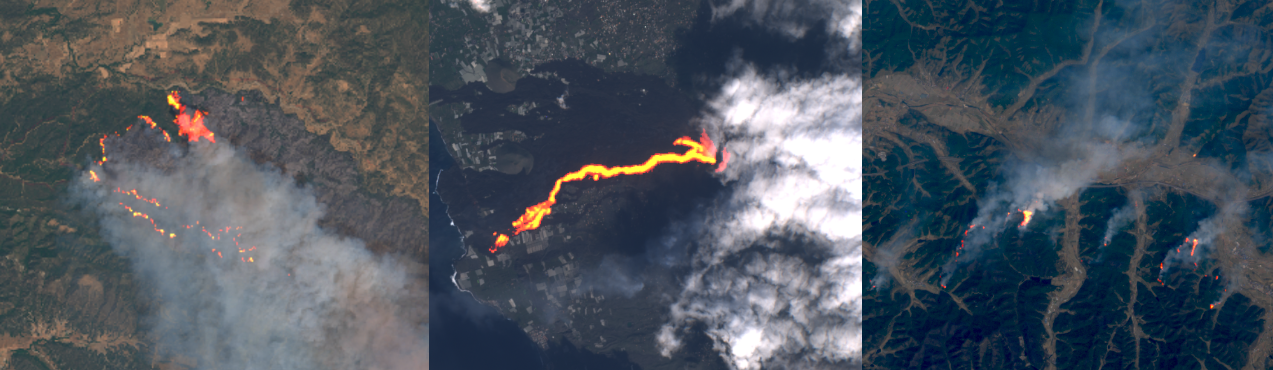
Enhanced Fire Detection
Shows fires and burned areas as bright red spots, making it easy to spot wildfire activity from space.
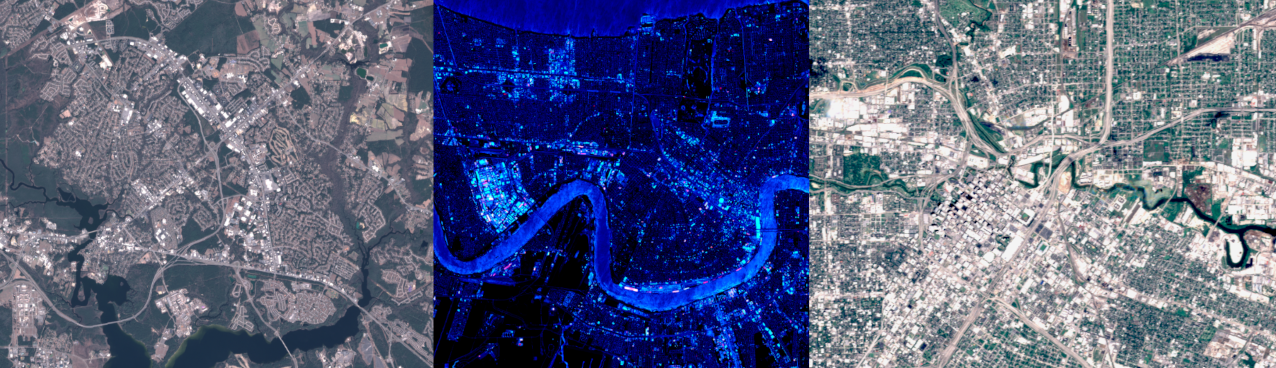
Enhanced Urban Natural Color
Helps cities and towns stand out better. You can easily tell where buildings, roads, and green areas are.
Synthwave Neon for Urban Areas
A fun, neon-style version of city maps. Bright colors highlight urban features in a visually striking way.
Geology
Enhances natural land patterns like rock formations, bare ground, and vegetation with strong color contrast, great for earth science.
Panchromatic Sentinel-2
Shows everything in black and white, a classic look that’s good for seeing surface texture and shape clearly.
Radar (Colored)
Shows reflected surfaces, useful for seeing through cloud. Reddish areas show buildings or rough ground, greenish areas show vegetation.
Radar (Grayscale)
Shows reflected surfaces, useful for seeing through cloud. Bright areas show buildings or rough ground, dark areas show smooth land or water.
It’s clear these filters are a powerful tool, not just for the expert user, but for everyday mappers too! With 19 built in filters, anyone can bring more context and information to their satellite imagery. Give it a try!
Disclaimer: This blog (and its screenshots) reflect Soar version 6.6. The interface and functions may differ in newer versions.